HANOVER, N.H. – April 23, 2020 – Throughout the U.S., especially in rural regions, there are still many places where there are currently no confirmed COVID-19 cases. Yet, a new study by the Dartmouth Atlas Project using data from The New York Times shows that if you group counties by where people get their hospital care, COVID-19 is everywhere.
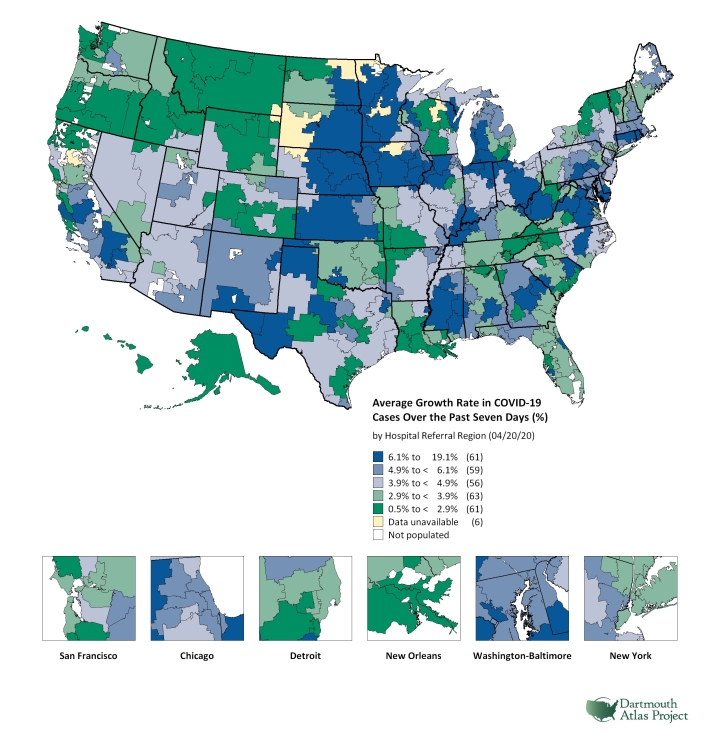
The study features three new maps depicting the: number of COVID-19 cases per 100,000; the average daily growth rate of COVID-19 cases in the last seven days; and the number of COVID-19 deaths per 100,000. This is part of the Dartmouth Atlas Project’s broader effort to better understand the geography of the ongoing COVID-19 pandemic.
The Dartmouth researchers aggregated county-level data by The New York Times on COVID-19 from throughout the U.S., including Alaska and Hawaii, to reflect the 306 “hospital referral regions” where residents get their hospital care. The hospital referral regions include where patients go for specialists in addition to where they are admitted when they are hospitalized. Since hospital referral regions include all rural areas of the country, the entire U.S. is represented in these regional analyses.
“The findings are clear: no region of the country has escaped the virus. Every region has at least 20 cases, while the vast majority have over 100,” explained Elliott Fisher, a professor of health policy and medicine at The Dartmouth Institute, who led this research for the Dartmouth Atlas Project.
Even though the pandemic is slowing thanks to many of the policies that have been put in place, the regional data reveals dramatic variation within and across states in both the baseline rates and growth rates over the last seven days.
Growth Rates of COVID-19 in U.S. Hospital Referral Regions
Image  |
“Regional data is essential as it can help reveal when it may be reasonable to begin to loosen physical distancing requirements. But it will also be critical to identify the new outbreaks that will likely occur as we try to do so,” added Fisher.
The research on COVID-19 data by U.S. hospital referral regions, which will be updated every weekday, represents the second timely project on COVID-19 by the Dartmouth Atlas Project.
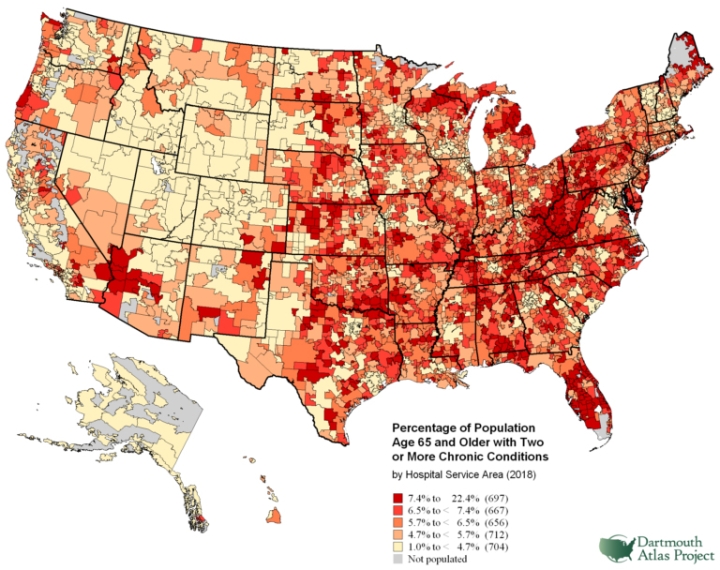
On April 9, the Dartmouth Atlas Project in collaboration with Microsoft Healthcare NeXT and CareJourney issued a dataset on the regions in the U.S. with Medicare beneficiaries over the age of 65 with two or more chronic conditions, who are the most vulnerable to severe cases of COVID-19. Chronic diseases included were diabetes, vascular disease, chronic kidney disease, heart disease, lung disease and cancer. Using 2018 Medicare claims data and U.S. Census estimates of the age distribution of the U.S., the research team created an index for 3,436 hospital service areas, which was categorized into quantiles of population risk from low to high risk. The data shows that the concentration of highest-risk people ranged from less than 2 percent to over 22 percent, with many living in Florida. Jonathan Skinner, a co-author of both studies and professor in economics at Dartmouth and The Dartmouth Institute, commented that “we hope that our work to identify regions in the U.S. with populations at greatest risk from COVID-19 will help public officials to contain this epidemic.”
Percentage of Population Age 65 and Older with Two or More Chronic Conditions, by Hospital Service Area (2018)
Image  |
Elliott Fisher (Elliott.S.Fisher@dartmouth.edu) and Jonathan Skinner (Jonathan.S.Skinner@dartmouth.edu) are available for comment. Anoop Nanda ’21, an undergraduate student and research assistant at The Dartmouth Institute (TDI), and Sukdith Punjasthitkul, a project manager at TDI, coordinated with Fisher and Skinner on the COVID-19 research regarding hospital referral regions, while Stephanie Tomlin, director of the Data Analytic Core at TDI, was a coauthor on the Medicare vulnerability project.

